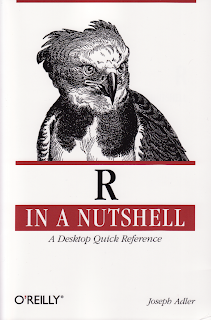
Friday, 8 October 2010
Book Review: R in a Nutshell

Thursday, 7 October 2010
Fibonacci retracement


"In financial mathematics, Fibonacci retracements are a method of technical analysis. They are named after their use of the Fibonacci sequence. Fibonacci retracement levels are based on Fibonacci ratios.
Fibonacci retracement is based on the idea that markets will retrace a predictable portion of a move, after which they will continue to move in the original direction.
These pullbacks are often traded or used as an opportunity to position for the direction of the original move.
Fibonacci retracements occur at distinct levels of the original move. Each Fibonacci level is considered to be an area where the market will likely find levels of support or resistance.
The four basic Fibonacci retracement levels are calculated as 23.6%, 38.2% 50.0% and 61.8%, signifying the portion of the move in the opposite direction of the original move. 0.0% is considered to be the start of the retracement, while 100.0% is a complete reversal to the original part of the move."
But what about the tribonacci numbers? These are similar to the Fibonacci numbers but including three terms in the sum. Do they have an application in finance? And what about the generalization of this sequence?
* This content is available under the Creative Commons Attribution-ShareAlike License.
Wednesday, 6 October 2010
Black-Scholes coupled system


The Black-Scholes equation
 and time t,


Tuesday, 14 September 2010
Tools of the trade
- octave: for general purpose numerical computations (an alternative is scilab)
- R: for statistics specific calculations, includes clustering, machine learning, among the others
- python: a powerful programming language that can be combined with many mathematical packages
- perl: another programming language better suited for text processing (you don't want to do all the work by hand, right?)
- maxima: symbolic mathematics software can be handy if the calculations become tough
- ruby: this programming language is not really needed, but gives a fresh way of thinking
- inkscape: a vector graphics tool for drawing flow diagrams (an alternative is dia)
Chaos economics?
The situation today has not changed a lot. There aren't any wizards, but there are still published thousands of papers and books about time series forecasting. Many software have been also designed to solve such hard problems. Techniques vary from statistical methods, to optimal control, to neural networks and many more.
The purpose of this blog is to present uncommon techniques that can be implemented with open source software. This means that 0€ must be paid in order to apply these methods, since all the software is freely downloadable from the internet. Some of the software I am going to use includes octave (or scilab), R, python, and others. All these programs will be used to study and forecast time series from stock markets and weather (cliche?), to client orders, or even number of blog followers.
However, there is a warning. All these stuff wont predict the future for you. There is no crystal ball. The methods and techniques presented here are just to show you alternative ways of analysing your data.